What is it for?
The Quality Report provides a detailed view of your performance, both in terms of quality and productivity. It also provides a history of changes made throughout the document, suggestions received and QA issues.

Who is the Quality Report for?
Translators and revisers
If you are a translator, the Quality Report in Matecat is your go-to page to keep track of your productivity and, above all, improve your work.
Thanks to an industry-standard analytical approach to calculating the score, you will always know precisely the quality level of your jobs. You can also easily retrieve all flagged issues and learn at a glance how to improve.
Project managers
If you are a project manager, you can use the Quality Report in Matecat to keep track of quality for your projects.
The score is updated in real-time and you can easily identify at a glance all flagged issues, in order to take action.
The indications about Post-Editing Effort (PEE) and Time to Edit (TTE) provide insights about productivity and the actual effort it took to complete the job.
NOTE: Time-to-edit is calculated by adding up the time a translator spends on each segment. If a translator goes back to the same segment several times (opening and closing the segment), the times for each edit are added together.
For the calculation of the Post-Editing Effort, on the other hand, some segments are excluded:
- Segments that have a time-to-edit of over 25 seconds per word, and
- Segments that have a time-to-edit below 0.5 seconds per word.
How is the quality score calculated?
Matecat uses an analytical approach to assess quality based on data provided by the reviser.
There are basically two categories of Quality Score: Pass and Fail. These are calculated based on EPT (Errors per Thousand Words), with thresholds that determine whether projects pass or fail at each revision stage. You can customize EPT thresholds, as well as other error categories and severities to label issues in the quality framework.
The numerical value of the score is calculated using this formula:
(total error points * 1000) / reviewed words
NOTE: reviewed words take into account segments that have been approved, excluding ICE matches.
On the other hand, ICE matches that have been modified for any reason are included in the reviewed word count.
The quality score is then compared to a maximum amount of tolerated error points for 1,000 words to determine the final quality.
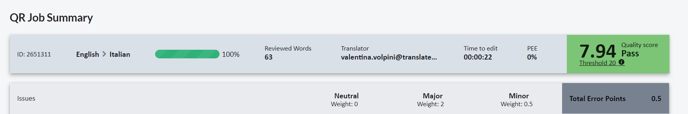
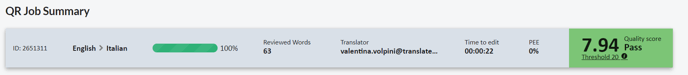
Looking at the example above, we can notice that there are 0,5 error points on a total of 63 reviewed words.
If we apply the formula we obtain
(0,5*1000)/63 = 7.94
QR in detail
The Quality Report in Matecat is divided into three main sections:
QR Job summary – Here you can find job data, such as final score, average post-editing effort and time to edit, as well as total weighted words and reviewed words.

Segment details – In this section, you can find the history and segment metadata.
For each segment, you will find some stats.
You can view the analysis of each segment, including whether it falls under a Machine Translation (MT) or internal match category, the time taken per word, and the associated post-editing effort.
To the right, you can identify whether the suggestion originated from Machine Translation (MT) or Translation Memory (TM). You will also see the match percentage if the suggestion comes from TM. Additionally, you can access information regarding the time to edit (TTE) for each segment.
When a segment has been revised, both the original translation and the updated version will be displayed.

To check how the segment has been modified, you just need to click on the "eye" icon.

If the reviser has flagged an issue within the segment, you will be able to view the specific type of issue along with its severity rating. Additionally, any comments made can be accessed by hovering your mouse over the bubble icon.

Download the Quality Report
If you need, you can download the QR in CSV, JSON or XML format.

Click on the 3 bullet points on the top right and select the format you prefer.
The downloaded file will include the issues and the comments as well.